

Introduction
In this paper we will work with the limit case of voluntary creditors and use empirical data on historical corporate recovery rates (“Moody’s Ultimate Recovery Database 2007”) and corporate leverage (Federal Reserve Economic Data) to attempt to quantify the difference in the risk borne by shareholders between the limited liability case and the unlimited liability case at the marketwide level. This is the main novel idea of the paper. The purpose will be to develop the theoretical technique, which future researchers can apply to more up-to-date or more extensive datasets. Using our technique and rough data, we will then draw some conclusions, discuss the implications of the result on the debate about limited liability and also provide direction for future research papers.
Research Objective
The shareholder benefit of limited liability can be calculated and compared using empirical data. The data will show a quantifiable and manageable difference in shareholder liability in the two regimes.
Materials and Methods of Research
The market selected for analysis was the US non-financial corporate credit market, as it is the largest such market with the most data available. Data was then sourced for current credit spreads, current leverage ratios and historical recovery rates following default. The data was then used to calculated the amount of risk transferred between shareholders and creditors, in a simplified model of limited liability.
Research Results
Limit Case - Voluntary Creditors
Assuming a world without involuntary creditors, for example legal awards of various kinds (tort claims, court imposed penalties, etc) and assuming a simplified case of a company with one class of equity and one bond, we see that the difference between the limited and unlimited liability regime is that in the event of default, the loss amount on the bond will be borne by the creditor in the limited liability regime and the shareholder in the unlimited liability regime (excluding the scenario where the shareholder in turn defaults and his losses are borne by his creditors). The loss amount is the claim amount on the debt, usually par plus accrued interest, minus the recovery amount paid by the bankruptcy estate. In this simplified calculation we will ignore accrued interest. It is trivial therefore that in the case of 100% recovery there is no difference between limited liability and unlimited liability regimes, because there is no loss to creditors be borne. In the case of 0% recovery, the difference in outcome for the shareholder will be the entire amount of the debt claim which would be claimed against the shareholder in an unlimited liability regime. For the cases with recovery not equal to zero or 100, the difference will be the loss amount (1-recovery). Therefore, it is trivial that the difference in risk for the equity holder of an individual company will be (probability of default) * (1-recovery), or the expected loss of the debt.
To extend this single company framework to a marketwide framework we need three things:
1) marketwide credit spreads for the chosen market (here we use US High-Yield non-financial corporates, given by Federal Reserve Economic Data, “FRED” and sourced from Bank of America [4]),
2) the relative frequency marketwide of each recovery rate as a percentage – we can see tables of historical recovery rates, (here given by the credit rating agency Moody’s database [5]) and
3) we need to know the amount of debt relative to equity on a marketwide basis, ie the general level of financial leverage in the market, (here given again by FRED [6]).
With perfect data we would have two histograms, one for recovery rates of defaulted companies in a specific market and the other for the financial leverage of all companies existing in the market, as well as credit spreads for that market. With even better data we would have the recovery rates of defaulted companies and the leverage ratio of those specific companies shortly before default. This is because the variables are not independent, higher leverage ratio companies will be expected to have lower recovery rates, due to a reduced equity loss buffer underneath the debt in the capital structure. Having the additional data would allow some form of correlation to be calculated. However, to calculate a more accurate correlation figure, far more data is required as the calculation is complicated by other factors, for example the industry of the defaulted company or the market conditions at the time of default, both of which will have a strong impact on both the leverage ratio and the recovery rate. The location of the company will be important as differences in bankruptcy law between regions will also have an impact on the recovery rate. A sensible way to proceed might be to perform the calculation on a single region and single industry, with data from the longest possible timeframe covering both stressed and normal market conditions. Then finally weighting the industries by their relative sizes and aggregating to get a single number for the whole market in that region.
Here we will work with a simple model without any information on correlation, ie where the recovery rate and leverage ratio are considered independent variables. This will likely be an underestimation for the risk as it is reasonable to expect that higher leverage companies are more likely to default and more likely to have lower recovery rates. In future research, the necessary dataset could either be sourced or a model dataset could be assumed for the purposes of developing the model to include correlations. Below we present the example dataset for our basic calculation:
Credit Spreads
For this example we are using FRED data sourced from Bank of America data for the US HighYield index [4]. The index has a duration ca 3-5yrs. We have selected the HighYield index since defaults of investment grade credit are rare, however in a correct analysis we would match the universe for credit spread data with the universe in which defaults are tracked. This is therefore an overestimate of default probability. As mentioned previously, the purpose here is to develop the model and draw rough conclusions from reasonable data rather than a precision calculation from high accuracy data.

Graph1 – [4] US HY Index OAS - https://fred.stlouisfed.org/series/BAMLH0A0HYM2#
Current US HY spread for non-financial corporates at the time of writing (Feb 2024): approx. 3.30% per annum
Recovery Rates
Here we will use the recovery rates reported by Moody’s [5]. The data for 720 US corp defaults is reported in the chart below, with mean of 52% and standard deviation of 26%. We can use a figure of 52% however this is an overestimate for recovery rate in our case as it is an aggregate of bond and loan defaults, and our credit spread data is for bonds only. Loans typically recover higher than bonds due to security (collateralisation).
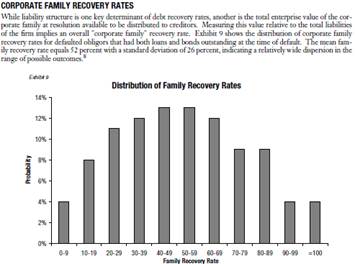
Graph2 – [5] Histogram of US Non-Financial Corporate Recovery Rates [5]
Leverage Ratio
This is given by the FRED data “Nonfinancial Corporate Business; Debt as a Percentage of the Market Value of Corporate Equities” [6]. In this case, market value refers to the market value of equity, so we are given the ratio of debt to equity.
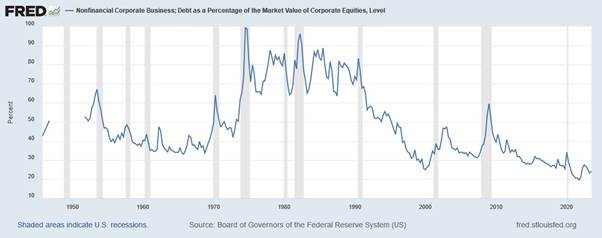
Graph3 – [6] US Non-Financial Corporate Leverage; Debt as a Percentage of the Market Value - https://fred.stlouisfed.org/series/NCBCMDPMVCE#
The most recent data at time of writing is 24.25%, so on average companies have roughly 4x more equity than debt.
Calculatio of risk assumed in unlimited liability regime
From previous discussion: (probability of default) * (loss given default) * (leverage ratio) = additional expected loss assumed by shareholders in unlimited liability scenario.
From the spread 3.3% pa and recovery rate 52% we can calculate a probability of default as 3.3% / (1-52%) = 6.875% pa
In the above formula this is: 6.875% * (1-52%) * 24.25% = 0.8% of the notional of their equity market value. It should be noted that we’ve used probability of default on an annual basis. This may be thought of as the risk of holding the equity for a year. Equity has no maturity date, so if we were to consider probabilities of default in perpetuity we would need to use 100% default rate. As Keynes famously said, “In the long run we are all dead”. In that case the calculation becomes: 100% * (1-52%) * (24.25%) = 11.6% of the notional of their equity market value.
It is worth noting, that in all cases no expected losses are gained or destroyed, they are simply shifted between creditors and shareholders. In the unlimited liability case shareholders assume the exact risk which would have been assumed by creditors in the limited liability case. Financing costs for corporates are unchanged in either scenario, this result is treated in depth in Halpern et al [3].
Conclusion
Using basic arithmetic and indicative data, and assuming a simplified scenario without involuntary creditors, we have shown a logical method for calculating the marketwide average difference in risk for shareholders in a limited liability regime versus an unlimited liability regime. One key argument for the necessity of widespread limited liability for corporates is the belief that without it stockmarkets would not function. The argument is that equity investors would be deterred from investing given the additional risk associated with accepting an unlimited liability as part of the equity investment. Therefore, quantifying exactly the amount of addition risk resulting from unlimited liability is an important element in understanding whether this argument is valid. Very indicatively, using rough data, we have demonstrated that in today’s markets and for US non-financial corporates, the additional risk assumed by shareholders if they were to invest in an unlimited liability format would be ca 11.6% of equity marketvalue. This means that in a limited liability regime, if a shareholder normally expects to lose 100% of his investment in the unlikely event of a corporate default, then in an unlimited liability regime he should expect to lose 111.6% of his investment, ie. his share market value today + an addition claim against his wealth for 11.6% of share market value.
This leads to two questions, whether 11.6% additional risk will dissuade equity investors from investing and exclude smoothly functioning stockmarkets, and also whether the resulting loss in equity investment demand is big enough to outweigh any negative externalities of corporate limited liability. To the author of this paper, it seems that even many multiples of this level of risk transfer between creditors and shareholders will have negligible impact on the functioning stockmarkets, and therefore is not a credible argument in the debate about widespread corporate limited liability regimes.
In future research work is needed to improve the model to include correlations or leverage and recovery rates, as well as extend the model from solely the voluntary creditor case to include involuntary creditors. The model can also be refined using the observations of Halpern et al [3], which explains that the existence of “directors and officers insurance” in modern insurance markets, and the ability of an unlimited liability company to contractually specify limited liability in a debt contract, all of which reduce the differences between the limited and unlimited liability regimes.
Библиографическая ссылка
Боулер Г.С. КОЛИЧЕСТВЕННАЯ ОЦЕНКА ПРЕИМУЩЕСТВ РЕЖИМОВ ОГРАНИЧЕННОЙ ОТВЕТСТВЕННОСТИ // Международный студенческий научный вестник. – 2024. – № 2. ;URL: https://eduherald.ru/ru/article/view?id=21527 (дата обращения: 19.05.2024).